


Spend time where it is most needed.
- Data integration is the first task in data analysis and the pain point for many users. Oftentimes, a great amount of effort goes into data collection and integration, leaving little time and resources for analysis.
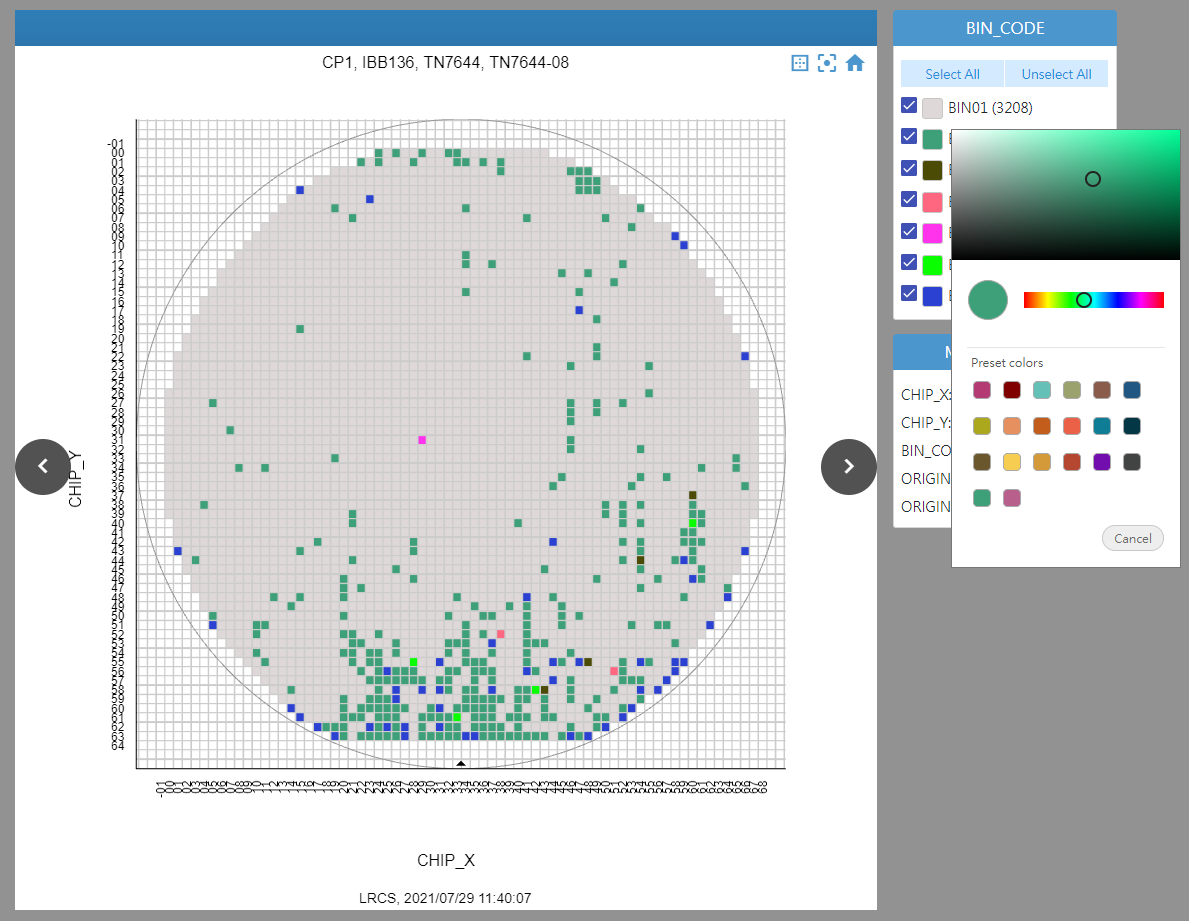
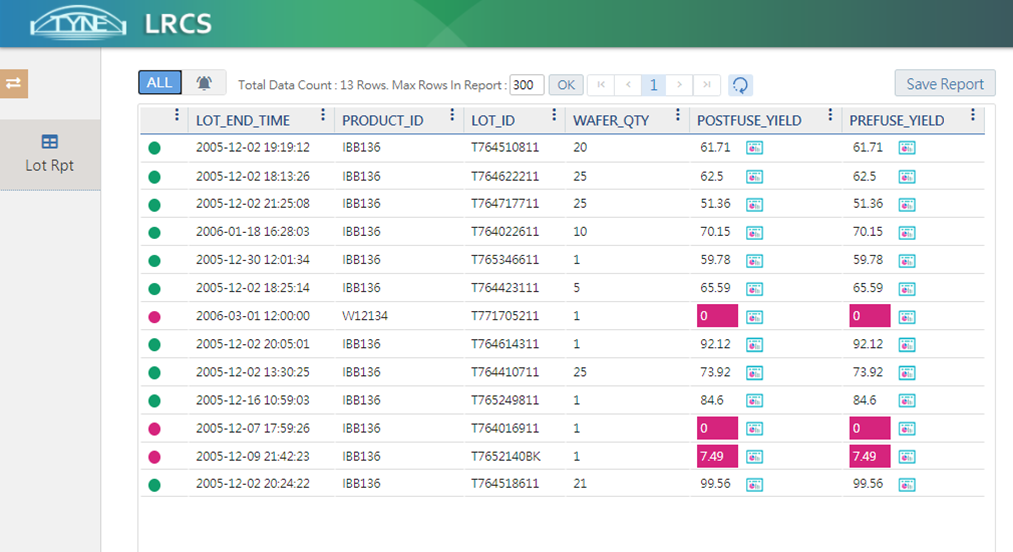
- In the semiconductor industry, CP and FT test data is massive, especially Datalog test data. Without a proper analysis platform, it is difficult enough for users to manually compile a whole batch of Datalog data, not to mention analyzing the baseline performance of multiple batches of Datalog at the same time.
- No doubt an experienced data integration partner can help you a lot!
Excellent engineering database design
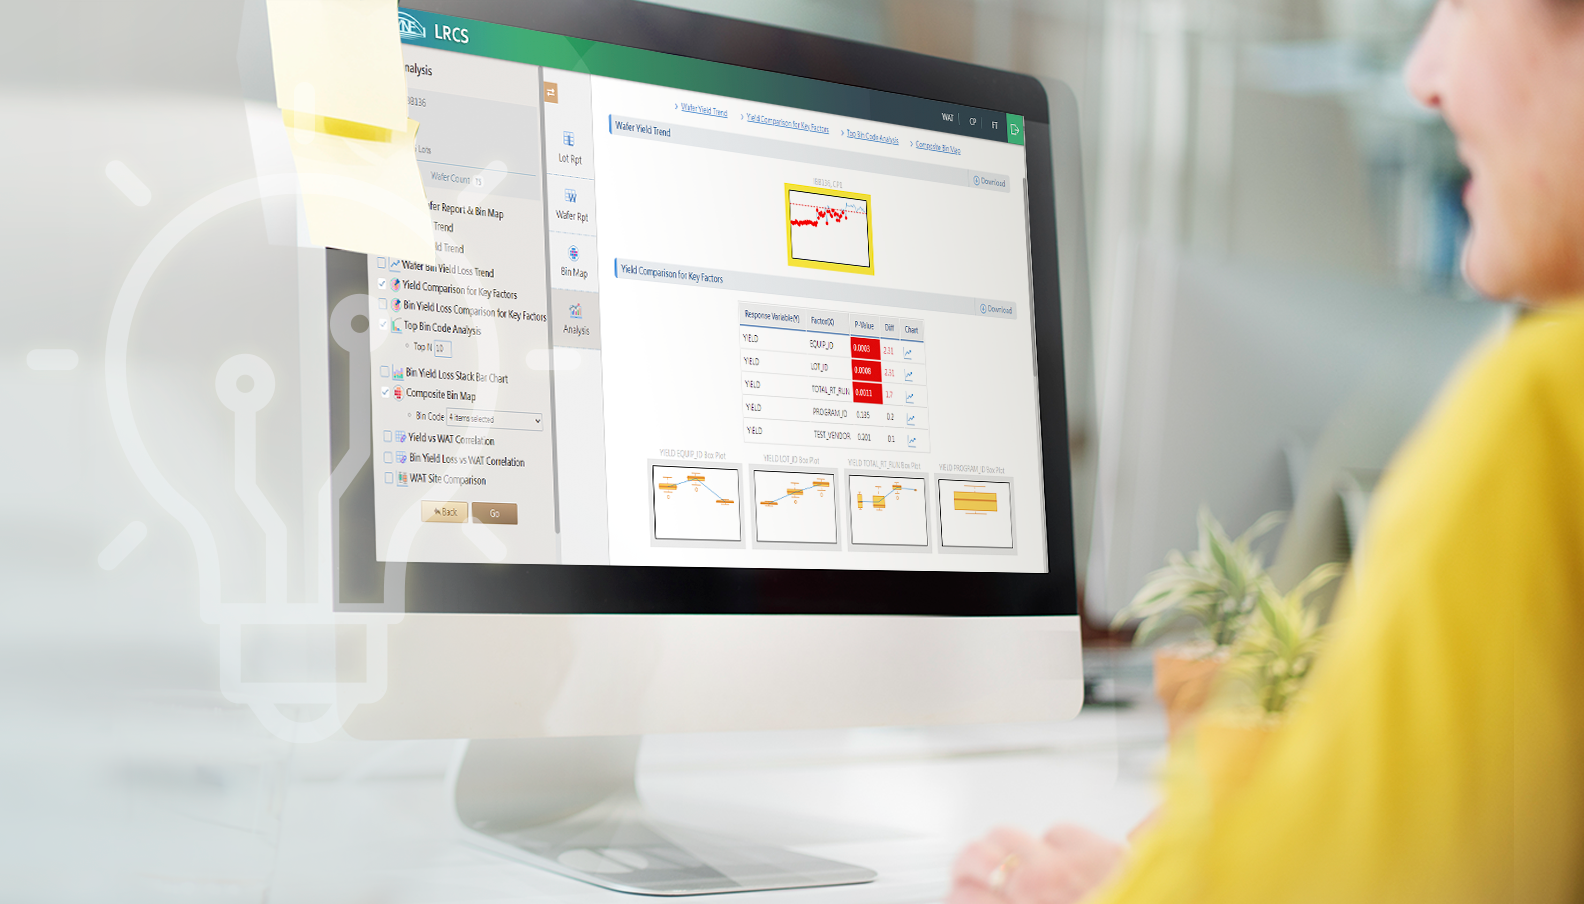
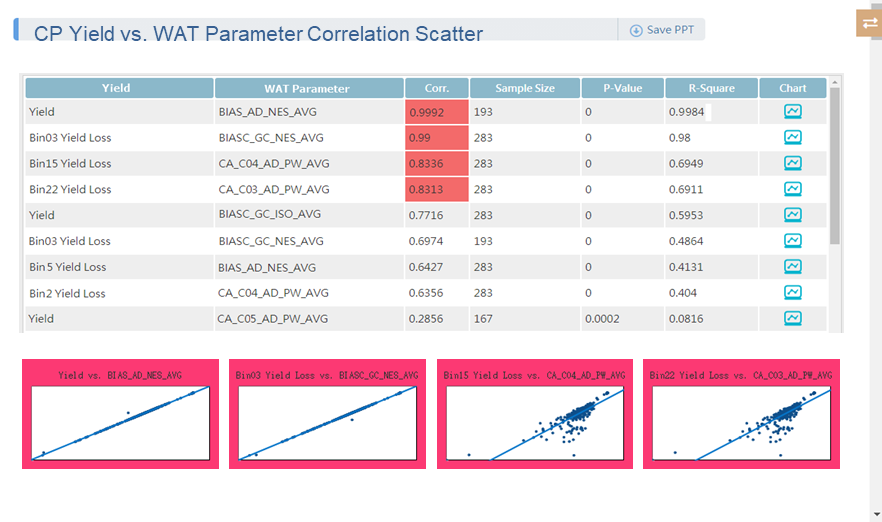
- TYNE, with 20 years of experience in implementing data analysis systems in semiconductor industry, helps companies integrate test data in WAT / CP / FT and other processes, fulfilling every specific analysis need and realize continuous yield improvement.
- In the data integration phase of the Yield Scanning system, TYNE helps companies integrate the Datalog data format from different testing houses. Users will no longer be bothered with the tedious process of data integration and can enjoy the new momentum of data after integration.