


Satisfy Diverse Needs from Different Industries
- TYNE has rich experience in collaborating with industries and can provide you with professional consultation during the project implementation phase.
- Our professionally-developed flexible structure can be applied to all sorts of data throughout the manufacturing process (incoming quality control (IQC), input process quality control (IPQC), and output quality control (OQC), just to name a few).
- Comply with comprehensive quality management guidelines; ensure sustainable quality improvement.
Flexibly Define Your SPC Charts
- The flexible system architecture allows data from all sources, including measurement machines, production machines, sensors, other databases of the facility, and even manual keyin, to be integrated to TYNE SPC System. No more worrying about special data types unable to be included in SPC.
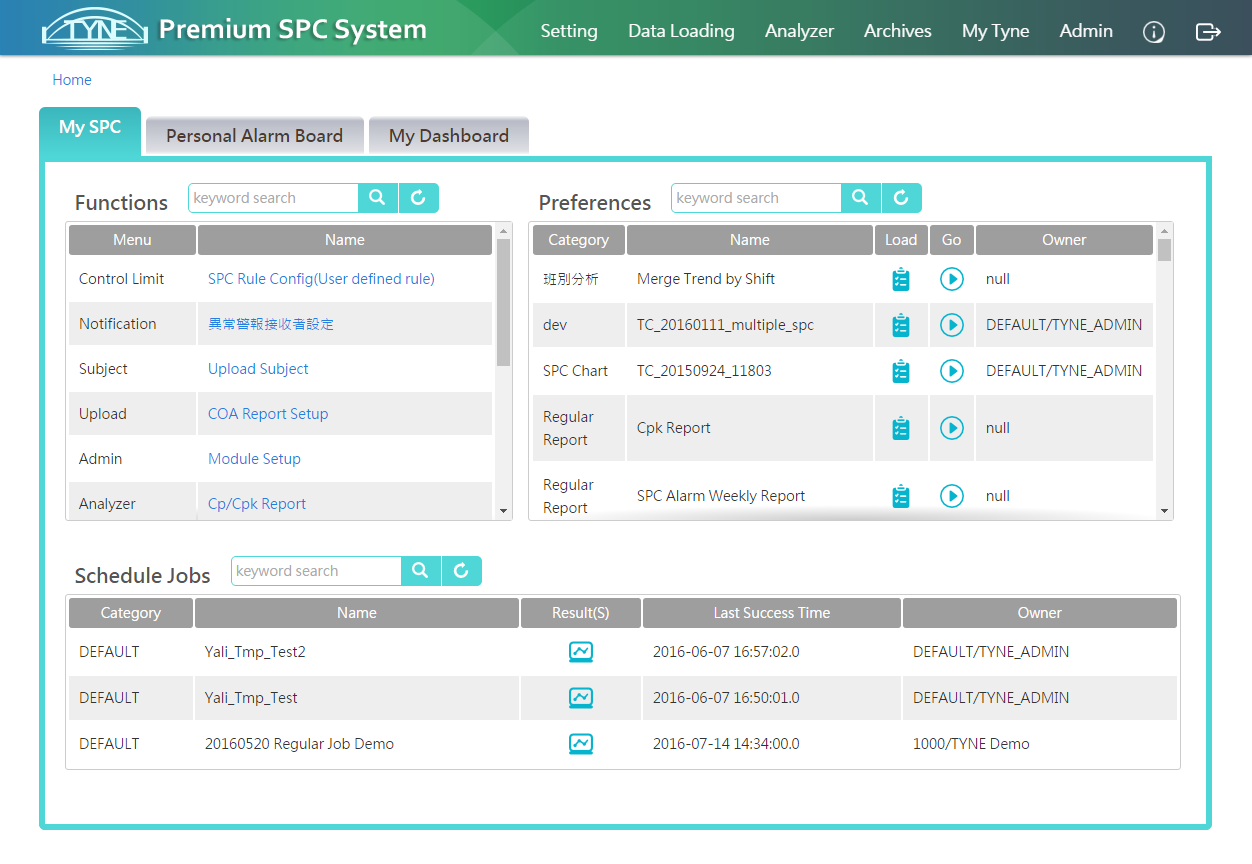
- The intuitive, simple, and flexible interface satisfies a variety of process data in different industries.
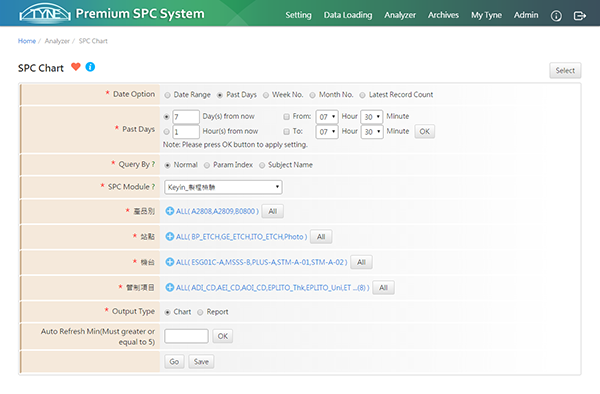
- SPC charts can be set with high flexibility in accordance with different monitoring and analytical purposes, meeting the control needs of different production units and analytical perspectives.
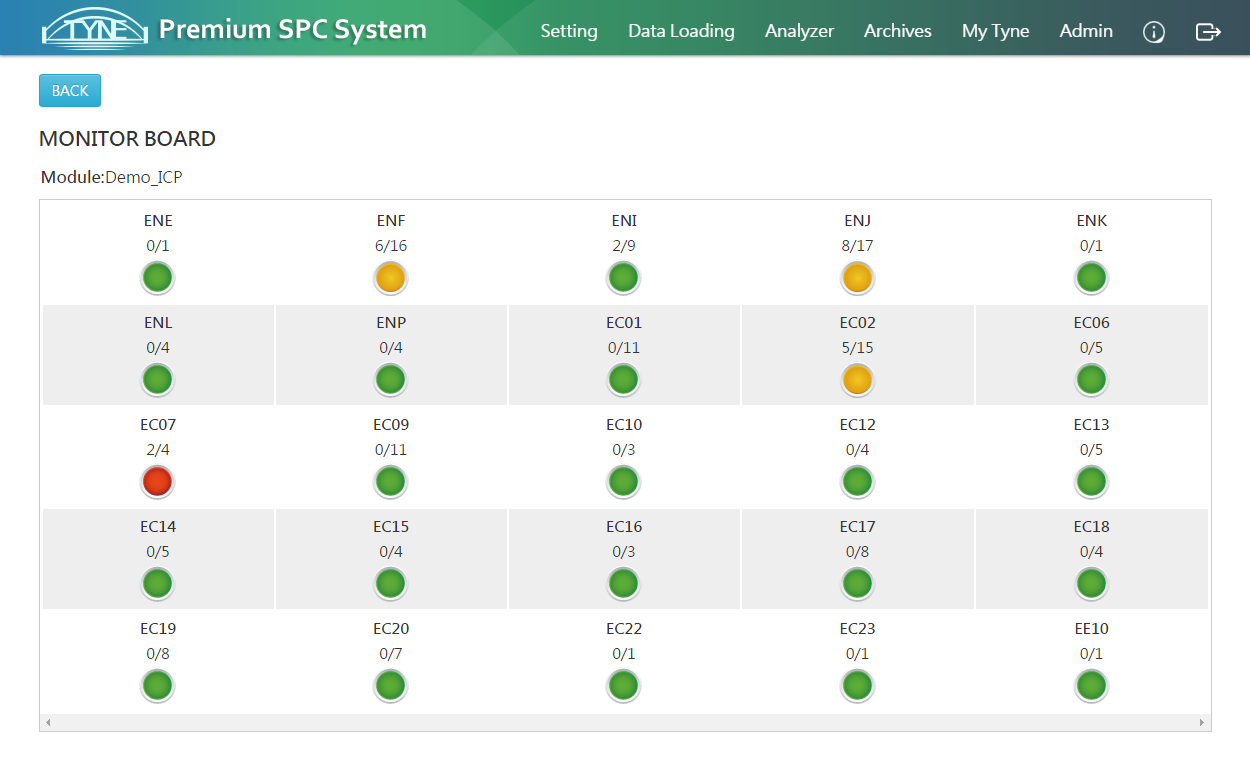
- Division of authority on user groups allows you to be able to focus solely on the SPC items that you are in charge of.
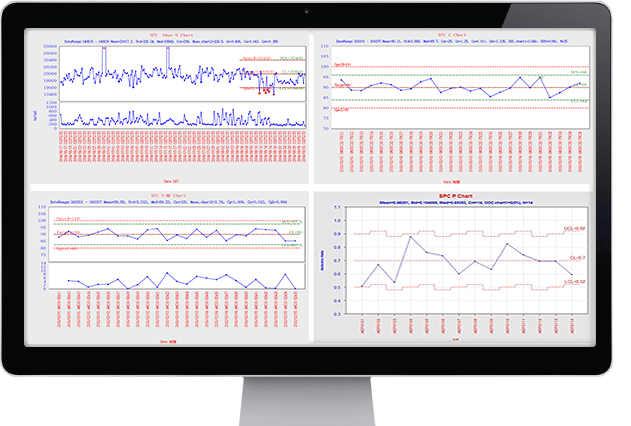
SPC Chart Types [Variable Data]
- Xbar Chart
- Xbar-R Chart
- Xbar-S Chart
- Xbar-U Chart
- MR Chart
- CUSUM Chart
SPC Chart Types [Attribute Data]
- P Chart
- NP Chart
- C Chart
- U chart03
Other Chart Types
- Trend Chart
- Merge Trend Chart
- Capability
- Bar Chart
- Stack Bar Chart
- Pareto
Comprehensive Statistical Analysis Indicators
- Provide statistical analysis indicators in accordance with different control charts or analytical purposes.
- Indicators such as Mean, Std, Std_hat (estimated standard deviation), Std_Raw (raw data standard deviation), Ca, Cp, Cpk, Cnpk, Cpm, Pp, Ppk, Percentile, etc. cover a variety of control charts, Cpk-related reports, and variance analysis needs, satisfying all your needs and more.